 /========================\
 |     SYSTEM ARTICLE     |
 \========================/
- Published on
- > DATE:
 /====================\
 |    SYSTEM OUTPUT   |
 \====================/
> Debugging Phoenix web applications with New Relic and CodeStream
====================
- Authors
-
-
- Name
- >
-

Since the Elixir language was introduced in 2011, it has exploded in growth and popularity. Elixir has been ranked as one of the most loved languages by developers, and many popular applications and sites are built with Elixir’s Phoenix web framework, including Discord, the Financial Times, and others.
While Elixir and Phoenix are blazing fast, you still have to watch out for performance issues in your production applications. You can use New Relic One to identify issues in your Phoenix application’s performance. Even better, with New Relic CodeStream, you can jump directly from the detected anomaly in New Relic to your IDE and the lines of code that are causing the issue. In this tutorial, you will learn how to leverage CodeStream from within New Relic One to increase your developer productivity. You will create a small web application, introduce a bug into it, and then use CodeStream to find the issue in your code.
This blog post assumes a working knowledge of:
- Elixir
- Phoenix
- Running commands in the terminal
- GitHub
You also need a New Relic One account along with the CodeStream integration. CodeStream is a free IDE extension available for VS Code, Visual Studio, and Jet Brains.
The sample application in this post is deployed to Heroku, and you can go to the README of the GitHub repository of the sample application and deploy the sample application with one click. Heroku is a cloud platform service that allows you to quickly deploy websites, and basic accounts are free. You can also deploy your application to any cloud deployment service you prefer.
Let’s get started!
You can find a complete working application at https://github.com/newrelic-experimental/nr-phoenix-demo-app if you want to clone the repository and try it out!
Creating a new Phoenix application with TailwindCSS
Create a new Phoenix application with TailwindCSS as the CSS framework for the application. After you have initialized a new Phoenix application with the mix phx.new #{name_of_your_app} command, add Tailwind by installing it in the /assets directory of your app. You can follow this tutorial for step-by-step instructions on how to do so.
Setting up the Phoenix application
The app has two routes. The first route is the home page while the second route directs to /make_trouble, which introduces a bug.
The main route uses the default template provided when you initialized your new Phoenix web app. You just need to add some styling using Tailwind classes to your HTML file to make a link to the Make Some Trouble path. Open the /templates/page/index.html.heex file and add the following HTML:
<section>
  <div class="bg-black text-white py-20">
    <div class="container mx-auto flex flex-col md:flex-row items-center my-12 md:my-24">
      <div class="flex flex-col w-full lg:w-1/3 justify-center items-start p-8">
        <h1 class="text-3xl md:text-5xl p-2 text-yellow-300 tracking-loose">Phoenix</h1>
        <h2 class="text-3xl md:text-5xl leading-relaxed md:leading-snug mb-2">
          ❤️ New Relic
        </h2>
        <p class="text-sm md:text-base text-gray-50 mb-4">Add New Relic monitoring to your Phoenix app deployed on Render</p>
        <a
          href="/make_trouble"
          class="mt-5 bg-transparent hover:bg-red-600 text-red-600 hover:text-black rounded shadow hover:shadow-lg py-2 px-4 border border-red-600 hover:border-transparent"
        >
          Make Some Trouble
        </a>
      </div>
      <div class="p-8 mt-12 mb-6 md:mb-0 md:mt-0 ml-0 md:ml-12 lg:w-2/3  justify-center">
        <div class="h-48 flex flex-wrap content-center">
          <div>
            <img class="inline-block mt-28 hidden xl:block" src="https://user-images.githubusercontent.com/54521023/116969935-c13d5b00-acd4-11eb-82b1-5ad2ff10fb76.png">
          </div>
          <div>
            <img class="inline-block mt-24 md:mt-0 p-8 md:p-0"  src="https://user-images.githubusercontent.com/54521023/116969931-bedb0100-acd4-11eb-99a9-ff5e0ee9f31f.png">
          </div>
          <div>
            <img class="inline-block mt-28 hidden lg:block" src="https://user-images.githubusercontent.com/54521023/116969939-c1d5f180-acd4-11eb-8ad4-9ab9143bdb50.png">
          </div>
        </div>
      </div>
    </div>
  </div>
</section>
Next, generate the controller, view, and context for the /make_trouble view by running the following mix command from the terminal:
$ mix phx.gen.html Page Trouble make_trouble
You are ready to add a bug to the view. Open /templates/trouble/index.html.heex and add the following reference to a variable that doesn’t exist:
<%= @not_here %>
Your router.ex file should have the following defined with both routes scoped to your web app:
get "/", PageController, :index
get "/make_trouble", TroubleController, :index
Your app should be fully functional at this point. You can boot it up by running mix phx.server and navigating to localhost:4000 in your browser. It’s time to install the New Relic Elixir agent and track down the bug!
Monitoring a Phoenix application with New Relic One
Now that you have a functioning Phoenix app, let’s add New Relic One monitoring and observability. There are three steps:
- Create a free New Relic account if you haven’t already. A free account gives you 100 GB/month of free data ingest, one free full-access user, and unlimited free basic users.
- Install the CodeStream extension integration with New Relic One in your compatible IDE. You can use the CodeStream Quickstart to get up and running in VS Code, Visual Studio, or all Jetbrains editors. Install the Elixir agent.
- Configure the Elixir agent.
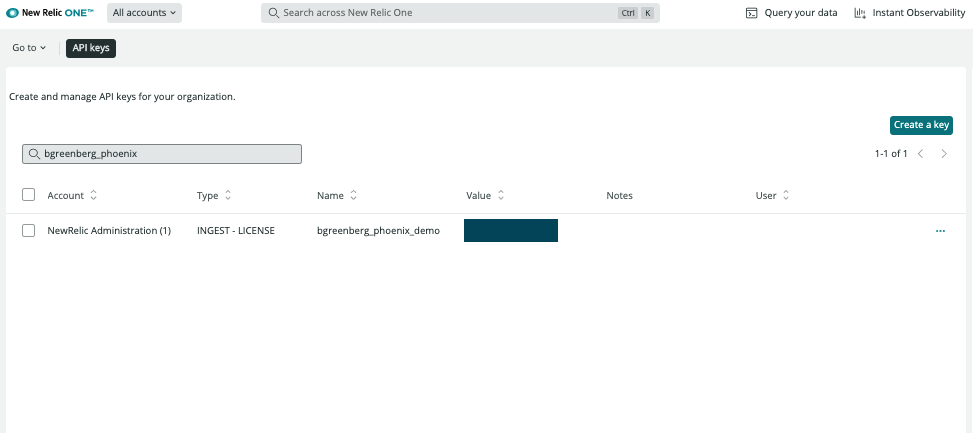
After you create an account, you can find your license key in the API keys setting of your new account. You need the license key to connect your application to your New Relic One account.

Install the Elixir agent by adding it to your mix.exs file as follows:
{:new_relic_agent, "~> 1.0"}
Then, open up the config.exs file and add a new config for the agent.
You can change the app_name as you like in your account. This example also uses an environment variable to store your New Relic license key. Make sure your license key is not committed to a public git repository as it is confidential.
New Relic One is now set up in your application and will begin tracking all the telemetry data, helping you diagnose issues and detect anomalies. This is true whether your application is running on your local computer, an on-premises server, or a cloud deployment. Let’s create an error and use CodeStream to track it down.
Using CodeStream to track errors
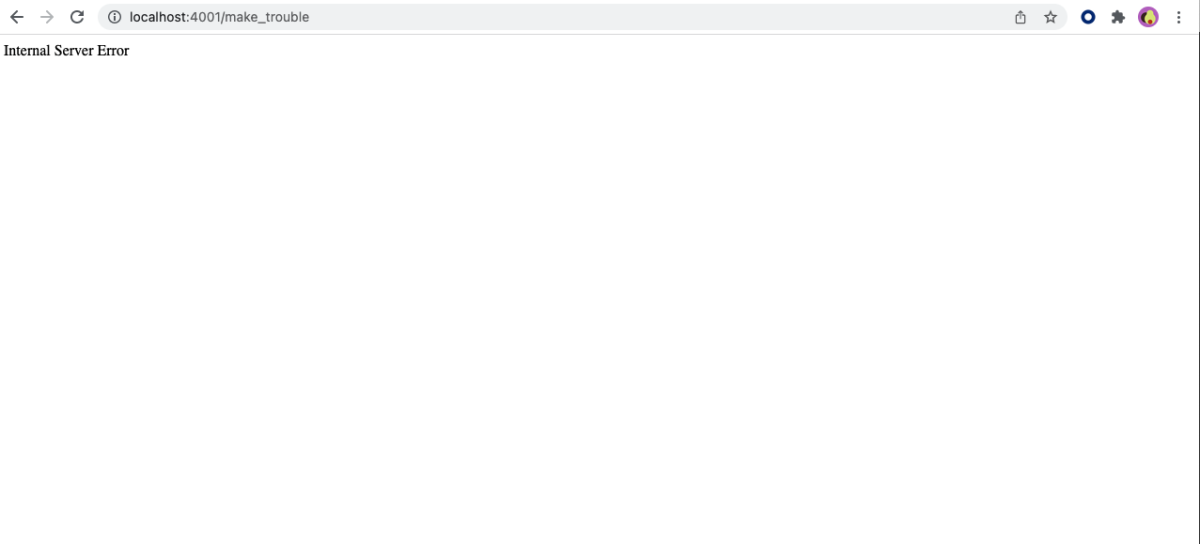
Navigate to your application in the browser and select the Make Some Trouble red button. This will produce an Internal Server Error page by default. You can always customize your error views in Phoenix, but this is the default view.

What went wrong? Let’s use New Relic One to find the error and then navigate directly to the error in your IDE.
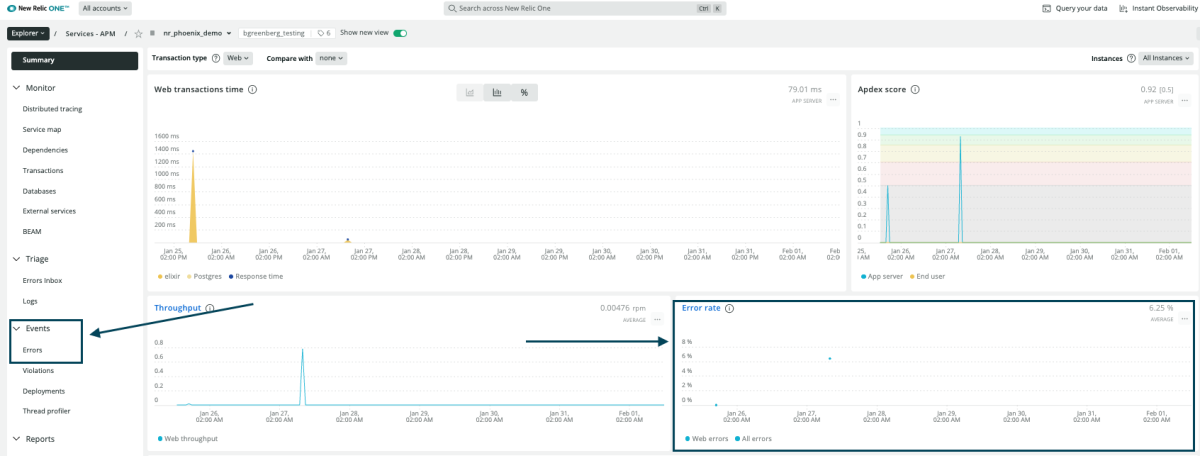
You can view the error from several different places in New Relic One. In the next screenshot, two possible paths are pointed out. One of them is through the Error rate visualization in the lower right corner, and the other is from the side navigation in the Events header.

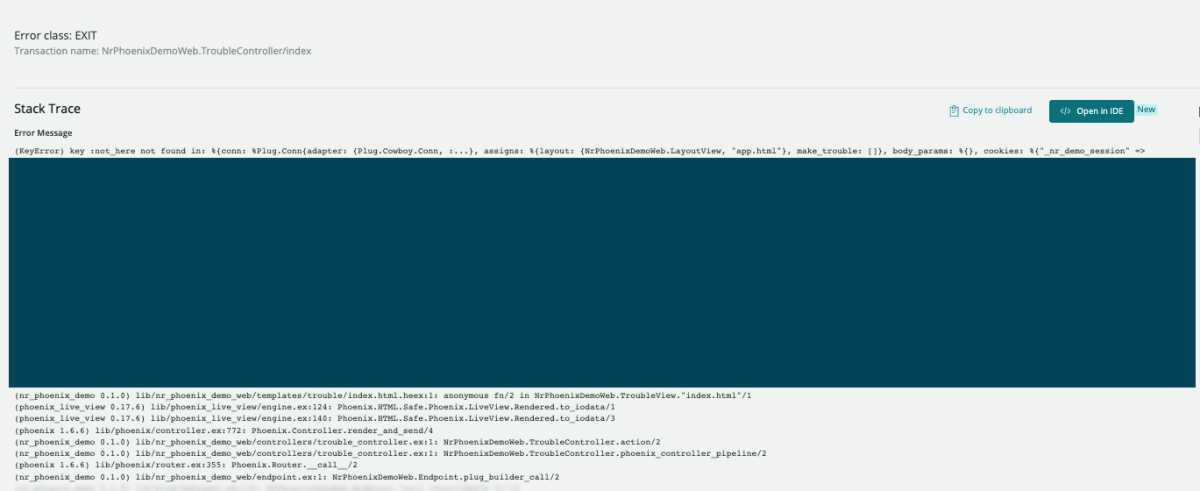
You can select any of the errors present to see more details. If there is a stack trace for the error, you can use CodeStream to go directly to the source of the issue in your IDE by selecting Open in IDE in the upper right corner.

With CodeStream added as an extension in your IDE and configured with your New Relic user key, you can look at CodeStream’s Observability tab in your IDE to see the source of production errors identified by New Relic without leaving your editor.
How are you using New Relic One to monitor, observe and debug your Elixir applications? Let us know by joining the conversation on the New Relic Slack or send us a message at devrel@newrelic.com!
Next steps
If you don't have a New Relic One account yet, sign up today. Your free account includes 100 GB/month of free data ingest, one free full-access user, and unlimited free basic users.
